

There's a magic trick Wall Street perfected somewhere between the financial crisis and today. It goes like this: take declining business performance, add a pinch of accounting creativity, sprinkle in a few hundred billion in share repurchases, and voilà—earnings growth appears from thin air.
Welcome to 2025, where "earnings growth" has become the most manipulated metric in modern market history. Companies aren't getting better at business. They're getting better at math.
And if you're betting your portfolio on EPS headlines, you're playing a game that's rigged from the start.
The Buyback Mirage: Manufacturing Value From Nothing
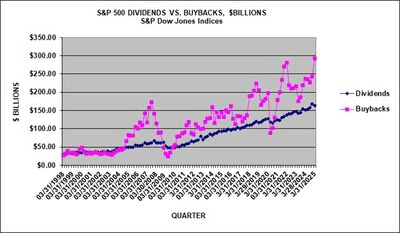
Let's start with the elephant in every boardroom: S&P 500 companies spent over $1 trillion on buybacks in the 12 months through September 2025. That's not a typo. One trillion dollars—more than the GDP of Indonesia—deployed not to build factories, develop products, or hire talent, but to reduce share counts and goose per-share metrics.
Q1 2025 alone set a quarterly record at $293.5 billion, up 24% year-over-year. And here's the punchline: 17.1% of S&P 500 companies reduced their share counts by at least 4% in Q3, automatically boosting EPS by the same amount without a single dollar of actual profit growth.
Think about that. No new customers. No revenue expansion. No productivity gains. Just fewer shares outstanding, which mathematically inflates earnings per share. It's the corporate equivalent of cutting a pizza into fewer slices and calling each piece "bigger."
The concentration is obscene. Just four companies—Apple, Nvidia, Alphabet, and Meta—accounted for over 22% ($55.2 billion) of Q3 buybacks alone. These aren't capital allocation decisions anymore. They're financial engineering arms races where the biggest players set the bar, and everyone else scrambles to keep up or watches their stock get decimated.
Southwest Airlines, facing a "choppy" operating environment, spent $2.75 billion on buybacks in 2025—a 12.6% buyback yield. The stock surged 23%. Kroger ended 2025 with a 14.4% buyback yield. Business fundamentals? Secondary. Share count reduction? That's the game.
And who benefits most? Not long-term shareholders. Insiders. Record buybacks coincide suspiciously with record insider selling. Management announces a massive repurchase program, the stock pops, executives dump shares into the artificial bid, and retail holders are left with an overvalued stock backed by nothing but financial alchemy.
The Non-GAAP Fiction: When 97% of Companies Create Their Own Reality
Now let's talk about the real sleight of hand: non-GAAP earnings.
In 1996, about 60% of S&P 500 companies reported at least one non-GAAP metric. Today? Over 97%. And here's the kicker: non-GAAP earnings are "invariably more favorable." In 2015, pro forma EPS were 30% higher on average than GAAP EPS.
Translation? Almost every company is now presenting a curated version of earnings that excludes anything inconvenient. Stock-based compensation? Gone. Restructuring charges? Excluded. Amortization of assets? Doesn't count. The result is a fantasy number that looks like profit but excludes the actual costs of running the business.
A 2025 study found that 71% of S&P 500 companies reported non-GAAP earnings, and of those, 89% reported figures higher than GAAP. Not some. Not most. Eighty-nine percent. The bias is structural and systematic.
Take McKesson Corporation's Q1 2019 report as a textbook example: it posted a GAAP loss of $0.69 per share. But "adjusted" earnings? $2.90 per share. How? By excluding "amortization of acquisition-related intangible assets, acquisition-related expenses, LIFO inventory adjustments, gains from antitrust settlements, restructuring charges, and other adjustments." In other words, by excluding nearly everything that actually happened.
Here's the ugly truth: 95% of S&P 500 companies use non-GAAP reporting, and these numbers are unaudited. Unlike annual results, quarterly non-GAAP figures face zero external audit scrutiny. Management has carte blanche to define "adjusted earnings" however they like, exclude whatever they want, and present a picture that's divorced from economic reality.
And why do they do it? Because these are the numbers that determine executive compensation. A WSJ survey found that 93% of CFOs pointed to "influence on stock price" and "outside pressure" as reasons for manipulating earnings figures. When your bonus depends on hitting an EPS target, suddenly everything becomes "non-recurring."
The AI Capex Illusion: Tomorrow's Write-Downs, Today's Hype
And then there's AI spending—the latest accounting fantasy dressed up as "investment in the future."
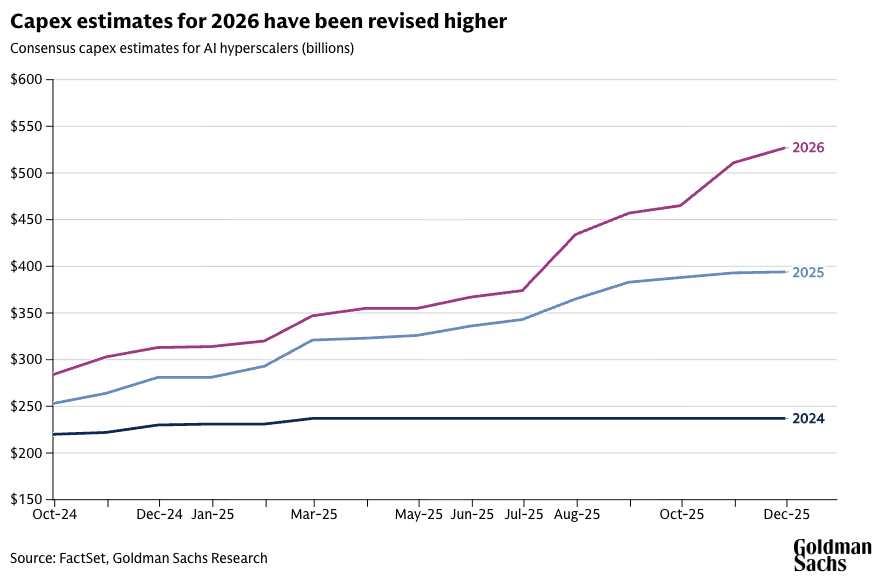
Big Tech is on track to spend over $400 billion on AI capex in 2025, with projections climbing toward $1.3 trillion by 2030. Amazon raised its 2025 guidance to $125 billion. Microsoft's capex surged 75% year-over-year to $34.9 billion in Q3 alone. Google bumped its 2025 budget to $92 billion. Meta is eyeing $100 billion in 2026.
Sounds impressive, right? Except here's what nobody's saying out loud: this spending is consuming 94% of operating cash flow minus dividends and buybacks for the Mag 7. They're not funding AI buildouts from profits anymore. They're financing it with debt.
Meta and Oracle alone issued $75 billion in bonds and loans in September and October 2025 to fund data center construction. JPMorgan estimates up to $7 trillion of AI spending will be borrowed money. Bank of America warns "The AI boom is hitting a money wall."
But here's the accounting magic: capex gets capitalized and depreciated over years. So that $400 billion in 2025 spending? It doesn't hit earnings all at once. It gets spread out, smoothed over time, making current-year EPS look better than the actual cash burn would suggest.
And when reality arrives—when AI monetization falls short, when demand doesn't materialize, when all those data centers sit underutilized—those assets get written down. Fast. Remember the dot-com bust? That's what happens when capex binges meet revenue disappointment. Today's "investment" becomes tomorrow's impairment charge.
Meanwhile, companies are already facing infrastructure shortages despite record spending. Microsoft's CFO admitted in July they thought they'd have better supply-demand balance by June, then by December. Translation? They're spending faster than they can even deploy the capacity, chasing a demand narrative that may or may not exist.
EPS vs. Free Cash Flow: The Divergence Nobody Talks About
Want to know if a company is actually profitable or just playing accounting games? Ignore EPS. Look at free cash flow.
Free cash flow measures actual cash—money in, money out, after paying for the capital expenditures needed to keep the business running. It can't be manipulated with accounting adjustments because cash is binary. You either have it or you don't.
EPS, on the other hand, is infinitely adjustable. Depreciation, amortization, stock-based comp, restructuring charges, goodwill write-downs—all of these hit EPS but not cash flow. Which means EPS can look great while the business is hemorrhaging cash, or vice versa.
And right now, that divergence is widening. Companies report record EPS while free cash flow stagnates or declines. Why? Because they're capitalizing expenses (spreading them over time on the income statement) while the cash goes out the door immediately. The capex gets spread out, earnings get smoothed, and EPS looks resilient even as cash generation deteriorates.
Apple is a case study. Over the past three years, revenue and earnings growth have stagnated as the company bought back more than $500 billion in stock. Free cash flow? It's not keeping pace with the buyback promises. So what did Apple do? Announced $600 billion in new investments over five years—a defensive move to protect existing profitability, not a sign of organic growth.
If FCF isn't growing but EPS is, you're not watching profit expansion. You're watching financial engineering.
The Real Problem: Fundamentals Aren't Improving
Strip away the buybacks, ignore the non-GAAP fantasies, adjust for AI capex inflation, and you're left with an uncomfortable truth: actual business performance is mediocre at best.
Revenue growth? Meh. Organic profit margins? Flat. Operating efficiency? Stagnant. The S&P 500 ex-Mag 7 has seen EPS estimates cut by 3.4% since the start of 2025, and by 8.2% since 2024. That's not a growth story. That's a buyback story masquerading as earnings momentum.
Even the headline S&P 500 growth is heavily skewed. Remove the Great 8 (the Mag 7 plus Tesla), and Q3 earnings growth drops to 12.1% vs. 17.6% for the megacaps. And that megacap growth? It's almost entirely driven by AI capex multiplier effects, not sustainable business expansion.
When earnings expectations drift lower across most markets, as they have in 2025, buybacks become the primary driver of total shareholder return. Not innovation. Not market share gains. Share count reduction.
That's not value creation. That's value redistribution—taking cash that could fund R&D, hiring, or real investment, and using it to mechanically boost per-share metrics. It works until it doesn't. And when the cycle turns, when access to cheap capital dries up or when regulators finally get serious about the 1% buyback tax (which did exactly nothing to slow the tide), the charade collapses.
Why This Matters Now
We're at an inflection point. Valuations are stretched, earnings quality is deteriorating, and the tools companies use to manufacture EPS growth are reaching their limits.
Bank of America credit strategists warn that tech companies "may be reaching a limit to how much AI capex they are willing to fund purely from cash flows." Meanwhile, 53% of fund managers in a November 2025 survey said AI stocks had reached bubble proportions.
Non-GAAP earnings continue to diverge further from GAAP, with the gap widening every quarter. Buybacks hit records while insider selling surges. And free cash flow is getting squeezed as capex balloons and organic growth stalls.
The market is pricing in continued EPS expansion. But the EPS you're seeing isn't real. It's a composite fiction built on share count math, selective accounting, and deferred costs that will eventually come due.
The Bottom Line
"Earnings growth" has become shorthand for "we reduced the share count and excluded everything that made us look bad." It's not a measure of business health. It's a marketing tool—a number designed to justify valuations and trigger bonuses, not reflect economic reality.
If you want to understand what's actually happening:
Look at free cash flow, not EPS
Ignore non-GAAP adjustments unless you've read the footnotes
Subtract buyback impacts to see organic profit growth
Watch capex intensity—if it's spiking without revenue following, trouble's brewing
Because here's the truth nobody wants to say out loud: fundamentals aren't being improved. They're being massaged, manipulated, and monetized by C-suites who know the game better than you do.
And when the music stops—when buybacks slow, when AI capex turns into write-downs, when non-GAAP fantasy meets GAAP reality—the earnings mirage will evaporate. Fast.
You can trade the illusion. Just don't mistake it for substance. Because in this market, "earnings growth" doesn't mean what it used to. It means financial engineering worked for another quarter.
Nothing more.
NEVER MISS A THING!
Subscribe and get freshly baked articles. Join the community!
Join the newsletter to receive the latest updates in your inbox.


