

The financial press loves its holiday metaphors, but the Santa Claus rally isn't just seasonal fluff for slow news cycles. Since Yale Hirsch coined the term in 1972, this seven-day window has delivered average gains of 1.3% for the S&P 500—more than double the typical weekly return. And it shows up with remarkable consistency: 79% of the time since 1950.
But here's where it gets interesting. After three consecutive years without a proper Santa rally—the last true rally was in 2018—2025 just delivered in spectacular fashion. On December 24, the S&P 500 breached the 6,900 barrier, closing at an all-time high of 6,909.79. By week's end, the benchmark had climbed to 6,929.94, posting a 2.3% gain for the holiday-shortened week.
So what exactly is this phenomenon, why did it disappear for three years, and what does its dramatic return tell us about where markets are headed in 2026?
The Seven Days That Matter More Than You Think
The Santa Claus rally runs from the last five trading days of December through the first two trading days of January. It's narrow, specific, and backed by decades of data showing it's anything but random. During this window, stocks historically rise 76% of the time, far above the 58% win rate for any random seven-day stretch.
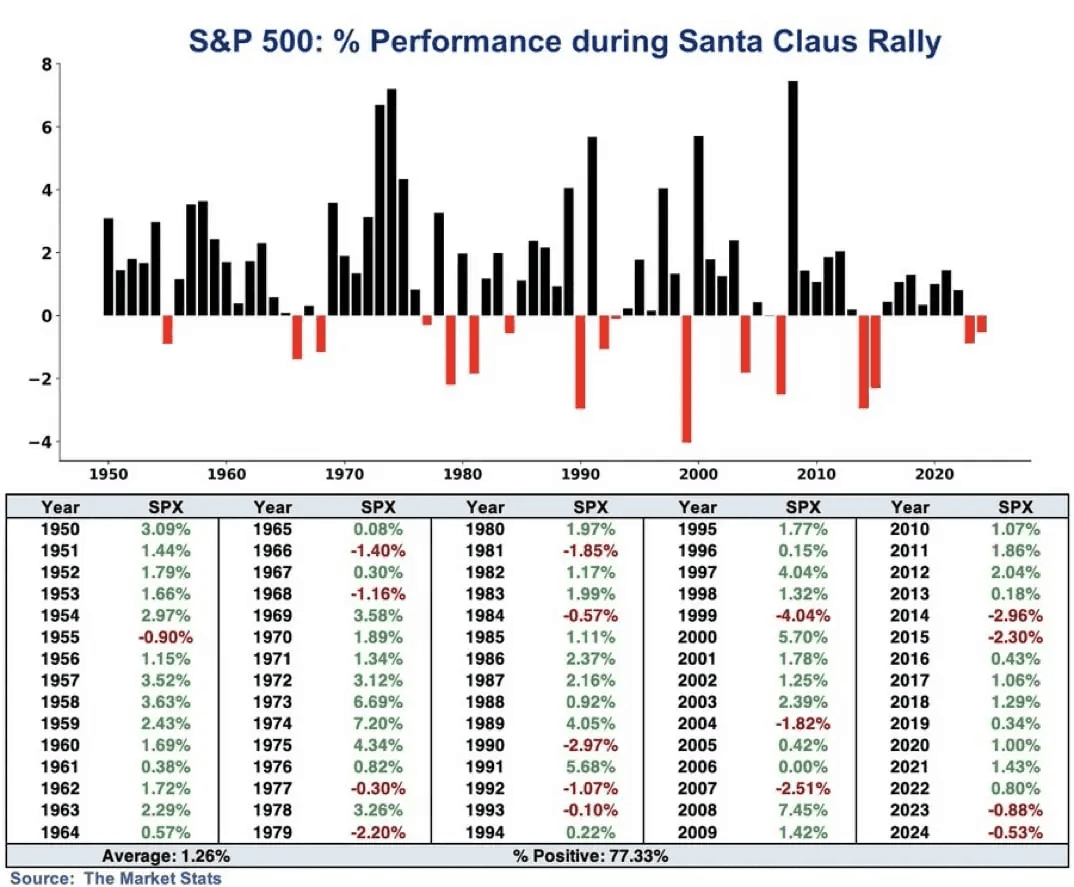
The numbers get more compelling when you zoom out. When Santa delivers, the S&P 500 averages a 1.4% gain in January and 10.4% over the following year. When he doesn't show? January drops -0.2% on average, and the following year delivers just 6.1%.
Yale Hirsch put it bluntly: "If Santa Claus should fail to call, bears may come to Broad and Wall."
Why Markets Rally When Everyone's on Vacation
The mechanics behind the Santa rally are less magical than you'd think—and more revealing about how modern markets actually function.
Thin liquidity amplifies moves. With institutional traders on holiday, lower trading volumes mean smaller buy orders have outsized impact on prices. It's supply and demand mechanics playing out in real-time: fewer sellers, same number of buyers, prices drift higher.
Tax-loss harvesting reverses. By late December, investors have already dumped their losers to offset capital gains. Come January, that selling pressure evaporates and buying resumes. The turn-of-year effect is well-documented: trading the last four days of a month plus the next two produces positive returns 64% of the time.
Window dressing gets real. Fund managers want their year-end holdings to look pristine for investor reports. That means buying winners and propping up positions in the final days of December—conveniently timed with the rally window.
Bonuses hit brokerage accounts. Year-end compensation flows into 401(k)s and IRAs in early January, creating genuine buying pressure as fresh capital enters the market.
Psychology becomes self-fulfilling. When enough traders expect a rally, they position for it. The expectation creates the reality—at least when macro conditions cooperate.
The Three-Year Drought: When Santa Stopped Showing Up
Between 2022 and 2024, the Santa rally failed to materialize—the last time the S&P 500 gained more than 1% during the rally period was 2018, when it rose 4.1% (ironically, after a 14.2% drop between Thanksgiving and Christmas that year).
The 2024-2025 period was particularly brutal. Not only did the rally fail—the S&P 500 declined every single trading day between Christmas and New Year's, marking the first time in the index's history that every session closed red. It was what traders called a "reverse Santa rally."
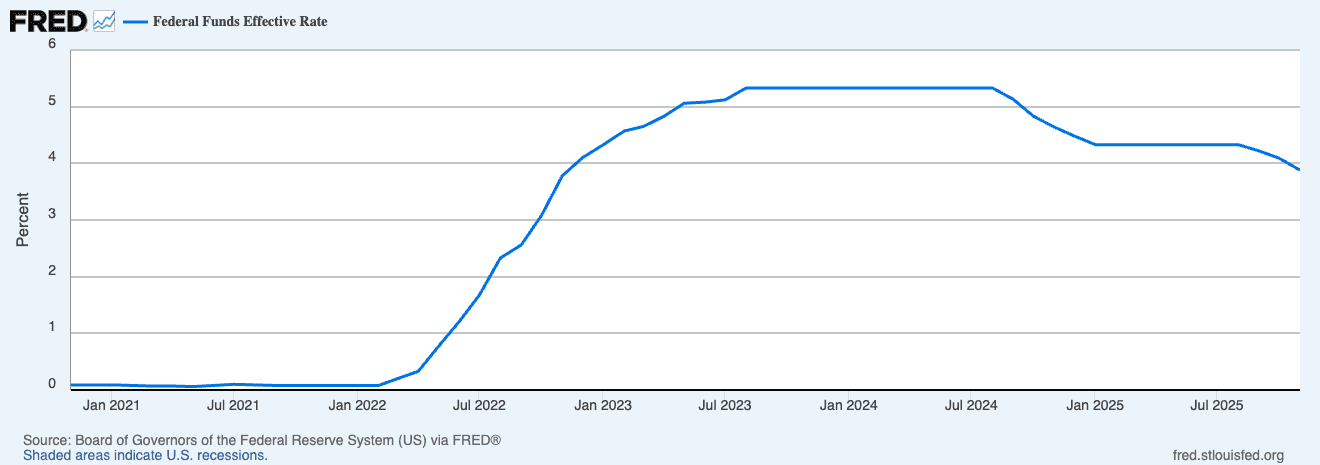
The culprit? The Federal Reserve's December 2024 meeting, where Powell delivered a rate cut wrapped in hawkish rhetoric. The Fed cut by 25 basis points as expected—but signaled only one additional cut for all of 2026, crushing expectations for a dovish pivot. Markets had been pricing in multiple cuts. The Fed effectively said: not happening.
Bond yields surged in response. The 10-year Treasury climbed toward 4.2%, making fixed-income suddenly competitive with equities again. Add in valuations at the second-highest level on record heading into December 2024, and you had the perfect setup for profit-taking.
2025: Santa Finally Returns
Fast forward to December 2025, and the setup couldn't be more different. The S&P 500 entered the holiday period up 17.9% year-to-date, having recovered from corrections earlier in the year. Momentum was positive. The Fed had completed its pivot. And most importantly—the pattern had never gone four years without showing up.
The rally delivered. On Christmas Eve, the S&P 500 officially breached 6,900, closing at 6,909.79 and marking its 39th record close of the year. By Friday, December 27, the index had climbed to 6,929.94—hovering just shy of the psychological 7,000 level.
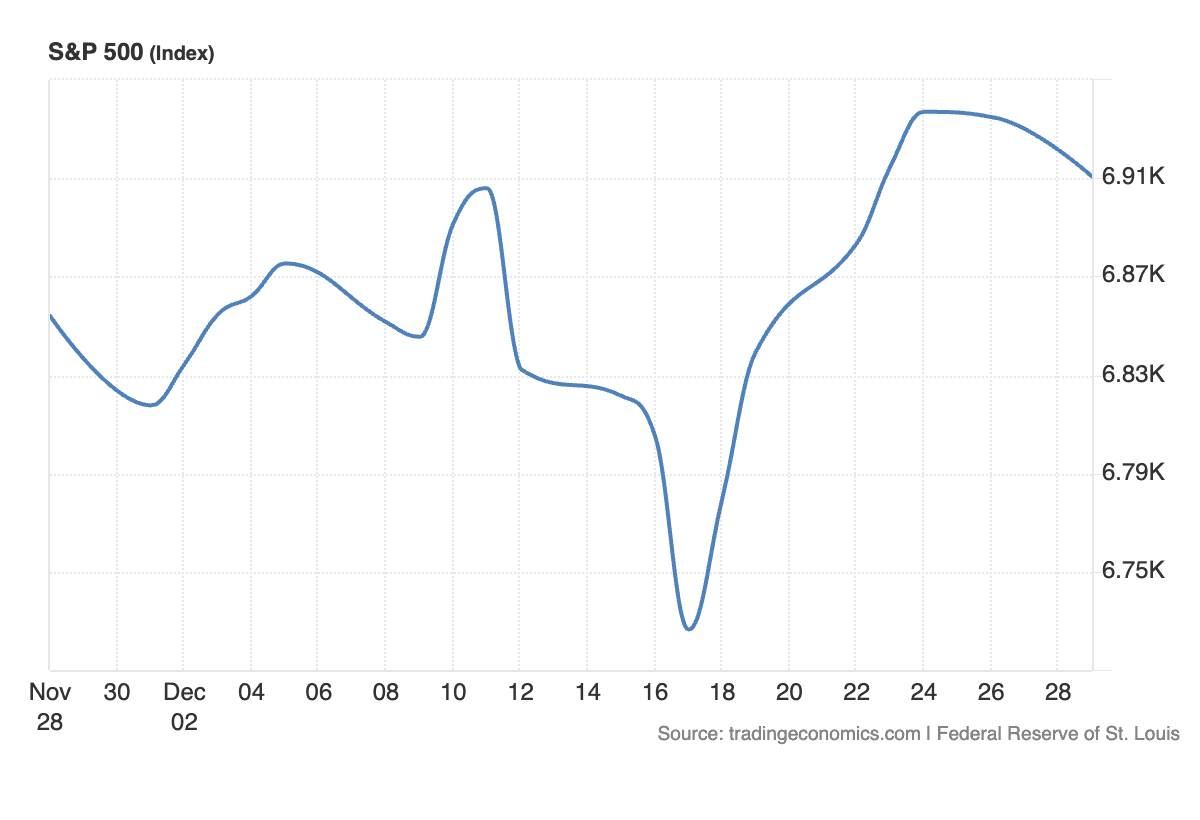
The holiday-shortened week delivered a 2.3% gain for the S&P 500, with the Nasdaq Composite up 2.5% and the Dow gaining 1.6%. "Momentum heading into year-end suggests a favorable setup for a positive Santa Claus Rally," Adam Turnquist, chief technical strategist at LPL Financial, wrote. "A historically bullish signal for January and the year ahead."
What Changed Between 2024 and 2025?
The contrast between 2024's historic failure and 2025's triumphant return comes down to three factors:
The Fed pivoted. Unlike December 2024's hawkish surprise, the Fed entered the 2025 holiday period having already signaled stability. Rates sat at 3.50-3.75% after multiple cuts, and the messaging was clear: no more tightening, but cuts would be data-dependent. That's Goldilocks territory.
GDP growth stayed hot. Q3 2025 GDP came in at 4.3%, well above trend. AI infrastructure spending—estimated to exceed $1.4 trillion over the next two years—powered the expansion. The narrative shifted from "can the economy avoid recession" to "soft landing achieved."
Seasonal momentum built naturally. Unlike 2024, where November's gains gave way to December weakness, 2025 saw steady accumulation through December. Investors weren't overextended. Positioning wasn't crowded. The rally had room to run.
The result? A textbook Santa rally playing out exactly as historical patterns predicted.
The AI Engine Behind the Rally
Make no mistake—the 2025 Santa rally wasn't just seasonality. It was AI capital expenditures contributing 37% to real GDP growth in 2025, adding roughly $500 billion to the economy. Without AI spending, growth would have stalled at 1.5%.
Nvidia continued its legendary run, gaining 36.8% for the year and becoming the first company to reach a $5 trillion market cap. Micron skyrocketed 229% as high-bandwidth memory demand hit fever pitch. Alphabet and Broadcom gained 64% and 47% respectively, proving the AI theme had legs beyond chip makers.
The market was trading at approximately 24 times forward earnings—elevated by historical standards, but justified by the productivity gains AI was delivering in real-time.
What 2026 Looks Like If History Holds
The historical data on successful Santa rallies is clear: they correlate with stronger forward returns. With the S&P 500 delivering on the seasonal pattern after three years of drought, the setup for 2026 looks constructive.
Wall Street strategists are bullish. JPMorgan and HSBC see the S&P 500 reaching 7,500 by year-end 2026. Morgan Stanley and Deutsche Bank are even more aggressive at 7,800 and 8,000, respectively—the latter representing more than 15% upside from current levels.
"Despite AI bubble and valuation concerns, we see current elevated multiples correctly anticipating above-trend earnings growth, an AI capex boom, rising shareholder payouts, and easier fiscal policy," JPMorgan lead equity strategist Dubravko Lakos-Bujas told clients.
But there are risks. The S&P 500's CAPE ratio averaged 39.4 in December 2025—a valuation last seen during the dot-com bubble. Historically, when the CAPE exceeds 39, the S&P 500 has averaged a 4% decline over the following year and 20% over two years.
The divergence between bullish strategist targets and bearish valuation signals sets up 2026 as a year where fundamentals will matter more than ever.
Don't Trade the Calendar, Trade the Conditions
The Santa Claus rally is real in the sense that it's a measurable, repeatable pattern. But it's not a trading strategy. It's context—a way to understand seasonal liquidity dynamics and sentiment shifts.
What matters more is positioning for the conditions that create or break the rally. Light liquidity amplifies moves in both directions. Fed policy trumps seasonality every single time. And valuations eventually matter, even if the market can stay irrational longer than you expect.
The 2025 rally returned because the Fed got out of the way, GDP growth stayed strong, and AI spending provided a genuine earnings catalyst. Those conditions remain in place heading into 2026—but they're being stress-tested by stretched valuations and elevated expectations.
The Takeaway: Patterns Return When Fundamentals Cooperate
The Santa Claus rally worked for 75 years, failed for three, then came roaring back in 2025. That's not a failure of the pattern. It's a reminder that markets are not algorithms, and seasonal tendencies are not laws of physics. They're probabilities shaped by human behavior, liquidity dynamics, and macroeconomic conditions.
2024 broke the pattern because the Fed broke expectations. 2025 restored it because the Fed delivered stability and AI delivered growth. 2026 will be shaped by whether earnings can grow fast enough to justify current multiples—and whether AI infrastructure spending proves to be productive investment or malinvestment.
So watch the Santa rally if you want. Just don't trade it. Trade the Fed, trade earnings, trade sentiment. The rest is noise.
NEVER MISS A THING!
Subscribe and get freshly baked articles. Join the community!
Join the newsletter to receive the latest updates in your inbox.


