

There's a certain thrill to watching a company slowly collapse under the weight of its own debt. Not schadenfreude, exactly—more like the grim fascination of witnessing a slow-motion car crash you saw coming miles away.
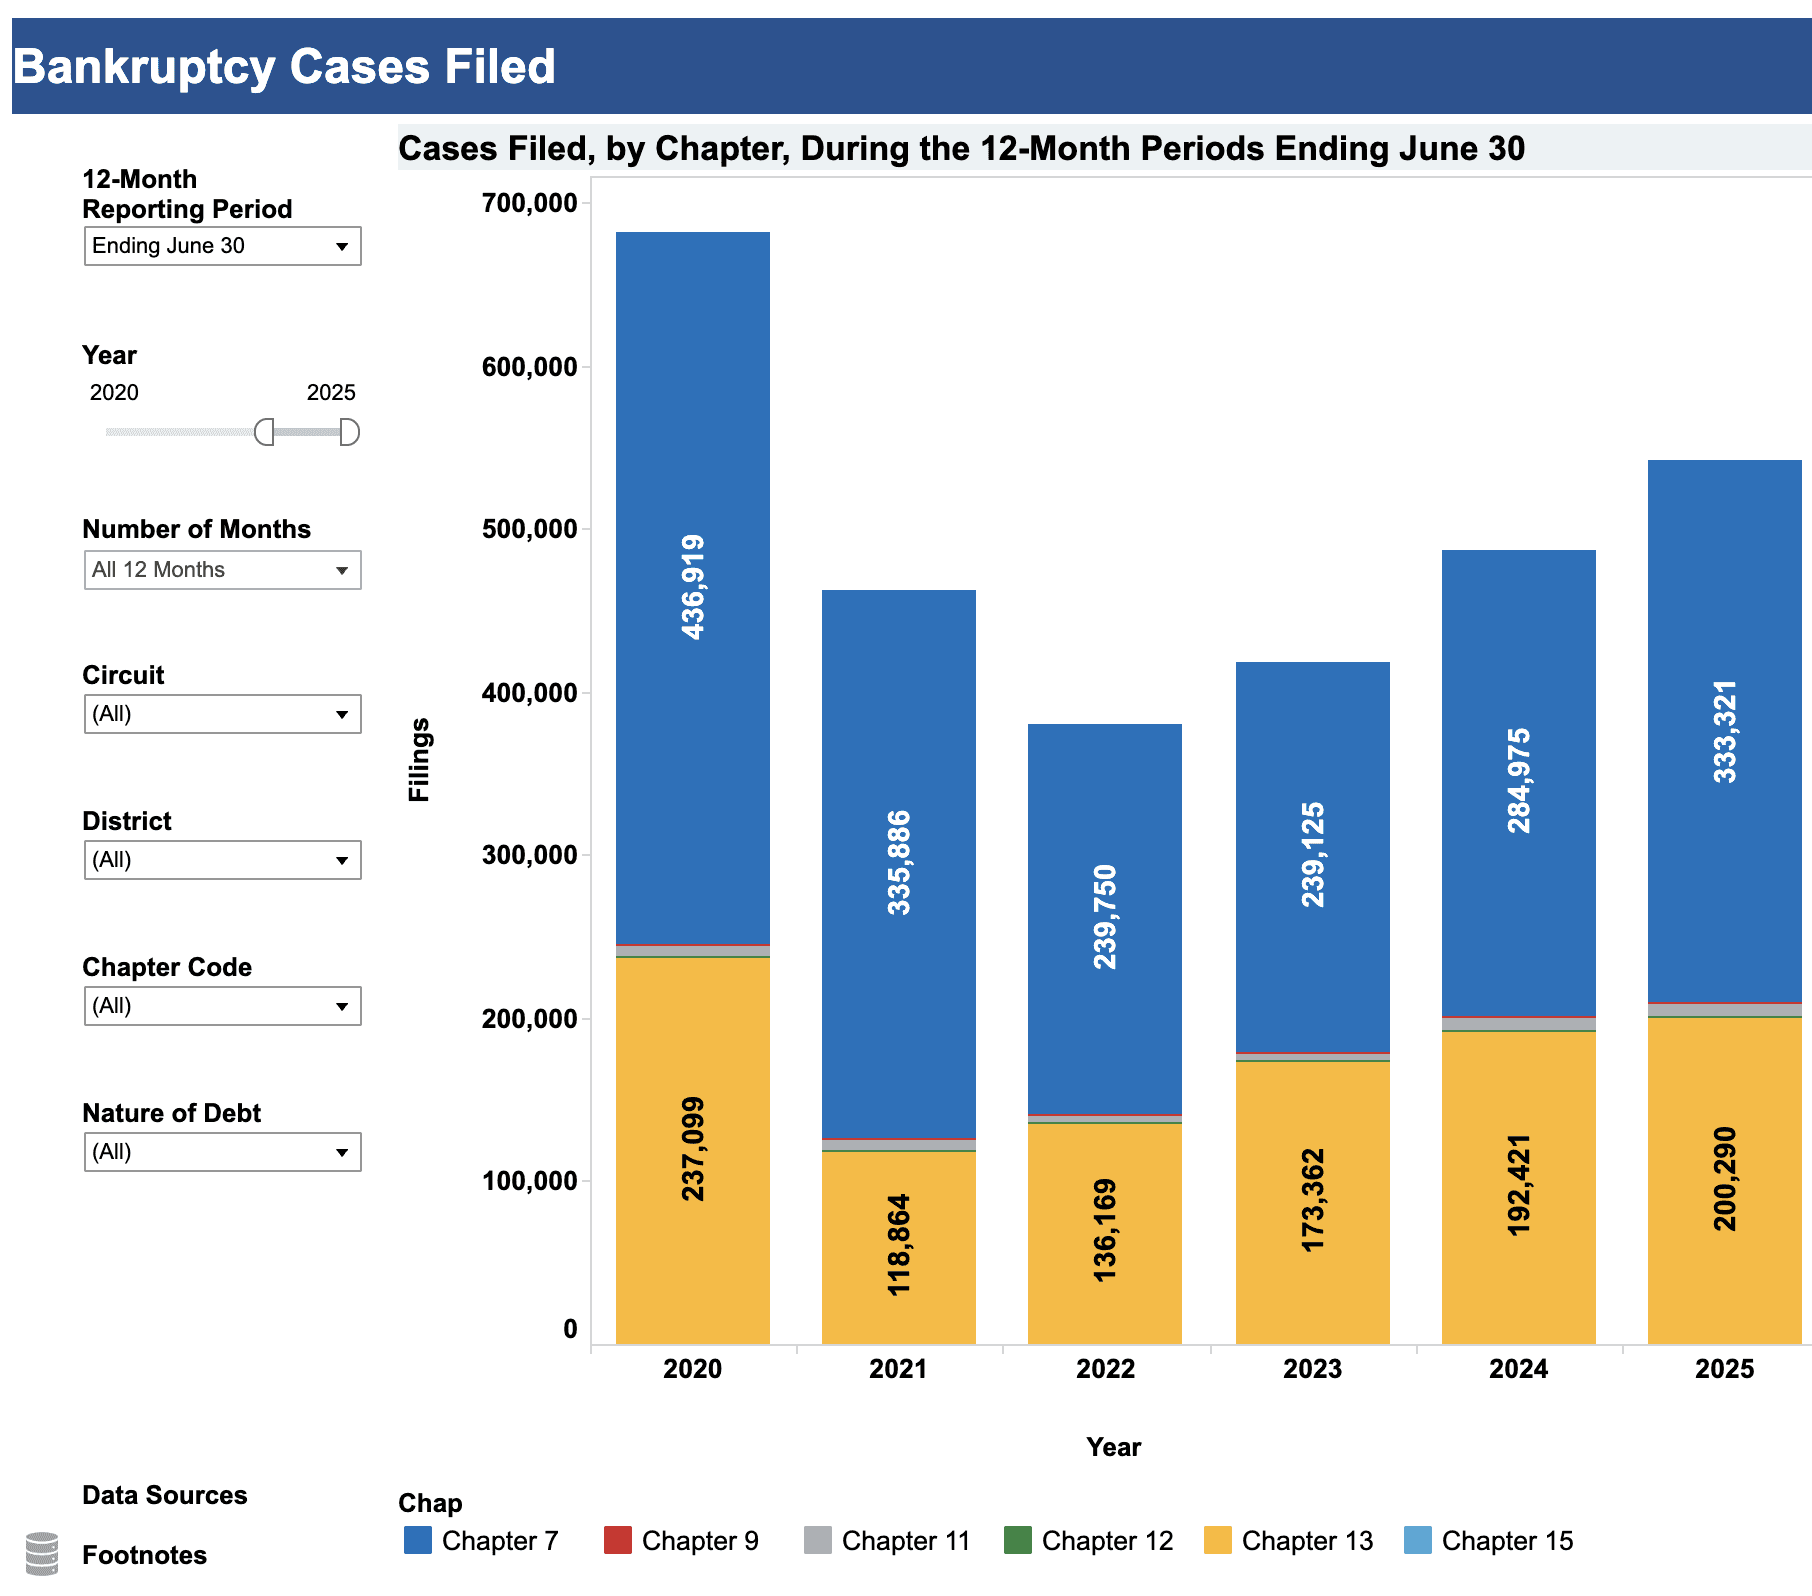
Corporate bankruptcies hit 694 in 2024, the highest level since 2010, and if you think that's bad, wait until you see what's lurking around the corner. About 38% of all outstanding corporate bond debt is set to mature in the next three years, and a lot of these companies are about to learn a harsh lesson: debt that was cheap to service at 2% doesn't stay cheap when you're refinancing at 7%.
The thing is, most of these disasters are entirely predictable. The balance sheet doesn't lie—it just whispers in a language most people don't bother learning. Let's fix that.
The $35 Trillion Elephant in the Room
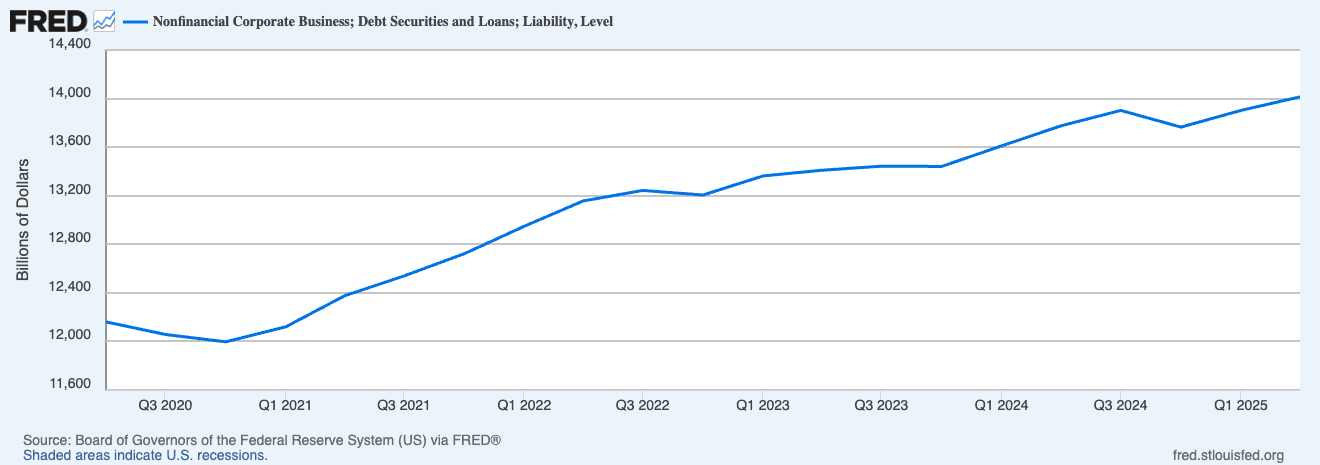
The outstanding global stock of corporate bond debt reached $35 trillion at the end of 2024, resuming its relentless upward climb after a brief pause. That's not "creative destruction" or "leveraging growth opportunities"—that's a mountain of obligations coming due at precisely the worst time.
Here's what nobody wants to talk about: since 2008, corporate bond issuance has grown $12.9 trillion above pre-crisis trends, while corporate investment came in $8.4 trillion below trend. Translation? Companies have been borrowing like drunken sailors, but instead of building factories or developing products, they've been buying back shares, paying dividends, and refinancing old debt with new debt.
It's musical chairs with junk bonds, and the music is about to stop.
The Refinancing Wall Nobody's Ready For
Interest rates on corporate debt are projected to rise from 4.20% in 2023 to 4.50% in 2025, and that's the optimistic scenario. For companies that gorged themselves on cheap debt during the pandemic, reality is about to get expensive.
In 2024 alone, 113 companies with more than $100 million in assets filed for bankruptcy, an 8% increase year-over-year and 43% higher than pre-2020 averages. The consumer discretionary and industrials sectors are getting hammered, but healthcare isn't far behind.
What's driving this carnage? Simple arithmetic. When you borrowed $500 million at 3% in 2020, your annual interest expense was $15 million. Refinance that same debt at 7% in 2025, and you're suddenly on the hook for $35 million. That extra $20 million has to come from somewhere—usually operating income, growth capex, or both.
The Debt-to-EBITDA Danger Zone
Let's talk about the single most important metric for sniffing out debt disasters: the debt-to-EBITDA ratio. This tells you how many years it would take a company to pay off its total debt using its operating earnings.
Companies in normal financial condition have a debt-to-EBITDA ratio of less than 3, while ratios above 4 or 5 usually raise alarm bells because they indicate a company is likely struggling to manage its debt burden.
But here's where it gets interesting: 58% of all debt on Asian non-financial companies' balance sheets was owed by companies with debt-to-EBITDA ratios above 4. Nearly a fifth of total Asian corporate debt belongs to companies with an interest coverage ratio below 2. And you thought the US was bad.
When you're analyzing a company, don't just look at the raw number—watch the trend. A company moving from 2.5x to 3.5x to 5.0x over three years is screaming "HELP" in balance sheet language.
Interest Coverage: The Canary in the Coal Mine
An interest coverage ratio (ICR) below 1.0 is a clear sign of trouble since it indicates the business can't pay its interest obligations. Analysts typically like to see ICRs of at least 2.0 for mature companies, though many believe an ICR exceeding 3.0 or 4.0 is important.
Think of it this way: if your operating income is $50 million and your interest expense is $40 million, your ICR is 1.25x. You're technically covering your obligations, but one bad quarter and you're toast. There's zero room for error.
Companies with an interest coverage ratio below 2 represent nearly a fifth of total Asian corporate debt. These aren't just "challenged" companies—they're zombies waiting for someone to notice they're already dead.
The truly dangerous part? For each additional dollar of interest expense, firms lower their capital expenditures by 10 cents and labor costs by 20 cents. So when refinancing costs spike, companies don't just suffer—they actively contract, cutting investment and jobs to service debt. It's a death spiral that feeds on itself.
The Red Flags You Can't Ignore
Balance sheets are dense documents designed to obscure as much as they reveal, but certain warning signs cut through the noise:
Declining cash flow despite rising revenue: If net income is growing but operating cash flow isn't, something could be off. Companies can manipulate earnings, but cash doesn't lie.
Ballooning "other" expenses: If "other" line items on the balance sheet have high values, find out what they are specifically. This is where companies bury uncomfortable realities.
Deteriorating liquidity ratios: Decreasing liquidity ratios may indicate liquidity challenges and suggest a company is burning through cash faster than it's generating it.
Rising debt-to-equity: A debt-to-equity ratio that is significantly higher than a company's peers is a potential red flag. Even worse is when the ratio rises while revenue and earnings growth don't follow.
Accounts payable stretching: A pattern of slowing accounts payable turnover ratios alongside weak cash flow and other liquidity issues is a big red flag. Companies delay paying suppliers to conserve cash, and that's never a good sign.
The Mega-Bankruptcy Surge
Let's zoom in on the carnage. In the first half of 2025, there were 17 mega bankruptcies—the highest number of any half-year period since the COVID-19 outbreak in 2020. These are companies with more than $1 billion in assets, and they're not going quietly.
Large corporate bankruptcy filers have increasingly pointed to shifts in the regulatory, legal, and policy landscape as a key driver of financial distress, particularly policies relating to renewable energy or international trade. In other words, companies that bet their futures on subsidies and favorable policy are discovering that Washington giveth and Washington taketh away.
The manufacturing industry is particularly interesting: 67% of manufacturing mega bankruptcies cited the regulatory, legal, and policy landscape as a key financial distress driver. Turns out, building a business model on government handouts isn't exactly sustainable.
The 2025-2028 Maturity Cliff
Here's where things get really spicy. In the US, high yield bonds totaling $160 billion are due to mature in each of the next two years, with another $229 billion maturing in 2028 and $307 billion in 2029.
That's not a "wall"—it's a tsunami. And unlike the loan markets, which have been pushing out maturities, the high yield bond market faces much larger refinancing requirements with nowhere to hide.
Speculative-grade maturities peak at $1.17 trillion in 2028. Think about that for a second. Over a trillion dollars in junk-rated debt needs to be refinanced in a single year, and that's assuming no more gets issued between now and then.
Good luck with that.
What Smart Money Is Watching
If you want to avoid getting caught in the debt death spiral, here's your homework:
Track the trend, not the snapshot: One bad quarter means nothing. Three consecutive quarters of deteriorating metrics means everything.
Compare to industry peers: A debt-to-EBITDA of 4.0x might be fine for a utility, but it's a disaster for a retailer.
Watch the maturity schedule: When is the debt actually due? Companies with debt maturing in 2025-2026 are in far more danger than those with 2030+ maturities.
Follow the cash: Revenue can be manipulated. EBITDA can be massaged. Free cash flow is harder to fake.
Pay attention to credit rating agencies: When Moody's or S&P downgrades a company, they're usually late to the party—but they're rarely wrong.
The Uncomfortable Truth
The average interest rate on corporate debt is projected to rise from 4.20% in 2023 to 4.50% in 2025, which doesn't sound like much—until you multiply it by trillions of dollars in outstanding debt. This implies a 5.5% increase in interest expense for corporates in 2025, or about $200 billion in additional costs economy-wide.
That money has to come from somewhere. It'll come from capex budgets, hiring plans, R&D spending, and ultimately, from shareholder returns. Companies that can't make that math work will join the growing pile of bankruptcy statistics.
The debt death spiral isn't some abstract concept—it's a mechanical process. Companies borrow. Interest rates rise. Cash flow gets squeezed. Credit ratings fall. Borrowing costs spike. Cash flow gets squeezed further. Rinse, repeat, bankruptcy.
The only way to win this game is not to play. As an investor, that means avoiding companies playing musical chairs with high debt loads and deteriorating fundamentals. Let someone else catch the falling knife.
The balance sheet is trying to tell you something. The question is: are you listening?
NEVER MISS A THING!
Subscribe and get freshly baked articles. Join the community!
Join the newsletter to receive the latest updates in your inbox.


